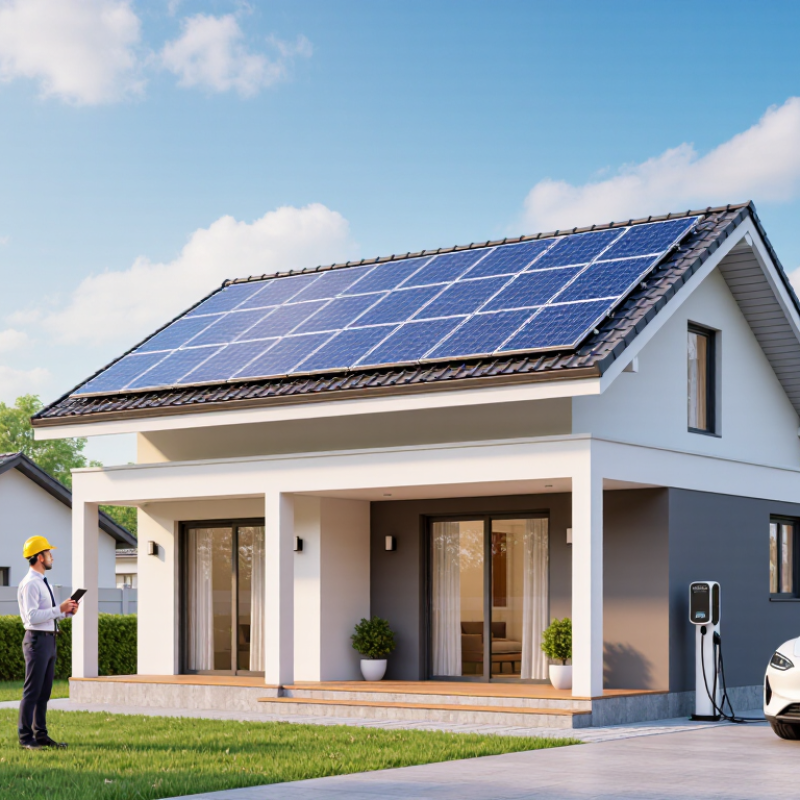
Choosing the right solar power system begins with your property, not a sales brochure. Roof direction, shading, local weather, electricity usage, and available space all shape the result. A south-facing roof may perform well in one region, while seasonal clouds or snow change expectations elsewhere. The choice matters.
The global market is expanding rapidly. IRENA’s Renewable Capacity Statistics 2024 reported 1,419 gigawatts of installed solar photovoltaic capacity worldwide by the end of 2023. However, larger industry numbers do not guarantee a suitable system for your home or business. System size should reflect hourly demand, not only annual consumption. A household with evening usage may need battery storage, while a daytime business could benefit from direct solar production. The International Energy Agency’s Renewables 2024 report also identifies solar PV as the leading source of new renewable capacity growth. That momentum supports wider adoption, but it can also encourage rushed decisions.
A reliable evaluation compares panels, inverters, batteries, warranties, installation quality, and maintenance access. The National Renewable Energy Laboratory’s PVWatts tool shows how tilt, azimuth, weather, and system losses influence estimated output. Treat estimates as planning tools, not promises. Real performance can fall below projections because of dust, unexpected shade, or inverter downtime. Small details matter.
This guide explains how to match system capacity, technology, storage, and budget with practical energy goals. It also highlights questions that installers should answer clearly. No single configuration is best for everyone. Even experienced buyers may revise their assumptions after reviewing twelve months of utility bills and a site assessment.
Choosing a solar power system starts with measured demand, not a roof-size guess. Collect twelve months of electricity bills and record each month’s kWh use. The U.S. Energy Information Administration reported average household electricity consumption of about 10,600 kWh in its 2020 Residential Energy Consumption Survey. Your household may differ sharply.
Peak demand matters more. A home using 900 kWh monthly may still need high output during a summer afternoon. Air conditioning, electric cooking, water heating, and vehicle charging can operate together. Request hourly or 15-minute interval data when available. NREL’s End-Use Load Profiles project models building demand at 15-minute intervals, showing why annual totals alone can hide short, intense peaks. List major appliances, their wattage, operating hours, and likely overlap. Photographing meter readings can also expose unusual patterns.
Size the system against both annual kWh and the highest practical load. Solar production changes with season, shading, temperature, and weather. NREL’s PVWatts documentation emphasizes hourly production estimates rather than simple annual assumptions. Battery capacity should reflect evening use and outage priorities, while inverter capacity must handle simultaneous loads. A spreadsheet helps, but it can still lie when habits change. I would test the calculation against a hot week and a cloudy week. Leaving a safety margin is sensible, though an oversized system may increase cost without matching real consumption.

Before selecting panels or an inverter, verify the solar resource at the exact site. NREL’s solar-resource datasets and PVGIS provide long-term irradiation estimates using satellite and weather observations. Compare monthly output, not only annual averages. A roof producing well in June may perform poorly in December. The IEA PVPS Trends 2024 report recorded about 456 GW of new photovoltaic capacity in 2023, showing rapid deployment. However, global growth does not guarantee strong production on every roof.
Shading deserves a physical inspection. Chimneys, trees, railings, and nearby buildings can create narrow shadows across cell strings. Even brief morning shading may reduce annual yield more than expected. Model horizon angles and obstruction heights in NREL or PVGIS tools, then apply realistic loss assumptions. A 5% shading estimate may be too optimistic. My practical mistake was trusting a clear midday photograph; the same roof had winter shadows before 10 a.m. Production estimates should include temperature, wiring, soiling, mismatch, and inverter losses. Use local measurements when possible.
Tips: Save the report’s coordinates, weather period, tilt, azimuth, and loss settings. Request a second simulation with conservative shading. Compare both results. If estimates differ sharply, investigate the input data before choosing system size. PVGIS documentation also warns that results are estimates, not guarantees. That limitation matters.
Sizing photovoltaic capacity starts with your daily electricity demand and local peak sun hours. Peak sun hours represent equivalent full-sun production, not total daylight.
A home using 30 kWh daily, with 4.5 peak sun hours and a 0.80 ratio, needs about 8.3 kW of panels. The 0.75–0.85 performance ratio allows for heat, dust, wiring, inverter, shading, and battery losses.
My first estimate would not be final. Winter sunlight, roof direction, and future appliance use can change the result.
Small errors matter. A system that looks adequate on paper may underperform during cloudy winter weeks. Recheck the calculation after one year of measured production.
Match the inverter to the array’s DC/AC ratio, not just the panel count. A 1.2 to 1.4 ratio often improves yearly energy production. The extra DC capacity helps the inverter operate near its efficient range during mornings, cloudy periods, and winter. However, excessive oversizing causes clipping when strong sunlight exceeds the inverter’s output limit. Some lost peaks may be acceptable, but the financial trade-off must be measured.
An inverter rated at 95–98% efficiency can still perform differently on a real roof. Heat, cable length, dust, shading, and low operating loads reduce actual output. Check the efficiency curve, not only the headline percentage. Ask for projected annual clipping and loss figures. A monitoring system should show daily DC input, AC output, and unusual temperature changes. Small details matter.
I once reviewed a design with a 1.35 DC/AC ratio. It looked efficient on paper. Yet the roof faced different directions, so clipping remained limited. A second design used the same ratio but placed every panel on one sunny plane. Its midday losses were much higher. That comparison changed my view. Ratio alone is not enough. Before approval, verify orientation, local weather data, inverter loading limits, and cable specifications with a qualified installer. Check the assumptions twice. They can be wrong.
How to Choose the Right Solar Power System?
Choose batteries by usable kilowatt-hours, not the headline capacity. A battery rated at 10 kWh may provide only 8 kWh at an 80% depth of discharge. The U.S. Department of Energy’s Energy Storage Handbook separates rated, usable, and deliverable capacity. That difference matters. Ask whether the quotation includes inverter losses, reserve capacity, and battery temperature limits.
Start with essential loads. List the refrigerator, medical equipment, internet router, lights, and water pump. Record their daily energy use in kilowatt-hours. If critical loads consume 2 kWh daily, one day of backup needs about 2.4 kWh after allowing for conversion losses. Three days may require roughly 7.1 kWh of usable storage. NREL’s 2024 Annual Technology Baseline uses 85% round-trip efficiency for lithium-ion storage, but real systems vary with age, temperature, and operating power. Do not treat that figure as a guarantee.
Depth of discharge also affects battery life. A deeper daily discharge may increase backup capacity, but it can accelerate degradation in some designs. Check the warranty’s usable-energy conditions, not only its year count. Keep a reserve for overnight use and unexpected outages. Solar recharge is equally important; three days of storage may still fail after several cloudy days. The weak point is often the load estimate. People forget pumps, startup surges, and winter heating. I would measure actual consumption for a week, then test the emergency circuits under realistic conditions.