How to Choose Solar Power Panels in 2026?
Choosing solar power panels in 2026 requires more than comparing attractive efficiency percentages. Your roof, climate, electricity use, and installation quality all affect real performance. A panel that works well in Arizona may produce differently under cloudy skies in Manchester. Even the best product can disappoint when shading, poor wiring, or weak mounting is ignored.
Fatih Birol, Executive Director of the International Energy Agency, said, “Solar is now the cheapest source of electricity in history.” That statement explains solar’s momentum, but it does not make every panel a smart purchase. Buyers should examine temperature coefficients, degradation rates, warranty terms, and independent performance testing. Look for clear product documentation. Vague promises deserve caution.
The decision should begin with your daily energy pattern. A household using power after sunset may need battery storage, not simply larger solar power panels. Ask installers for shade analysis, roof-load checks, and projected annual output. Request several written quotes with labor, permits, maintenance, and replacement assumptions included. Small details matter.
A tidy spreadsheet cannot capture every rooftop. Real homes are imperfect. Dust gathers near panel edges, trees grow, and electricity prices change. Therefore, compare realistic estimates rather than ideal laboratory figures. Experienced installers should explain losses plainly and provide verifiable certifications. They should also discuss recycling and safe end-of-life handling. The right choice balances output, durability, repair access, and total lifetime cost. Efficiency alone is not the answer.
Define Your Solar Needs Using PVWatts and Local Roof Conditions
How to Choose Solar Power Panels in 2026?
When choosing solar panels in 2026, start with your electricity use, not panel advertisements.
Download twelve months of utility bills and note seasonal changes. Enter your location and system details into PVWatts. This tool estimates production using solar radiation, roof direction, tilt, and system losses. Test several system sizes. Compare estimated annual output with your actual consumption. The result is useful, but it is not a promise. Weather remains unpredictable.
Your roof may change the decision.
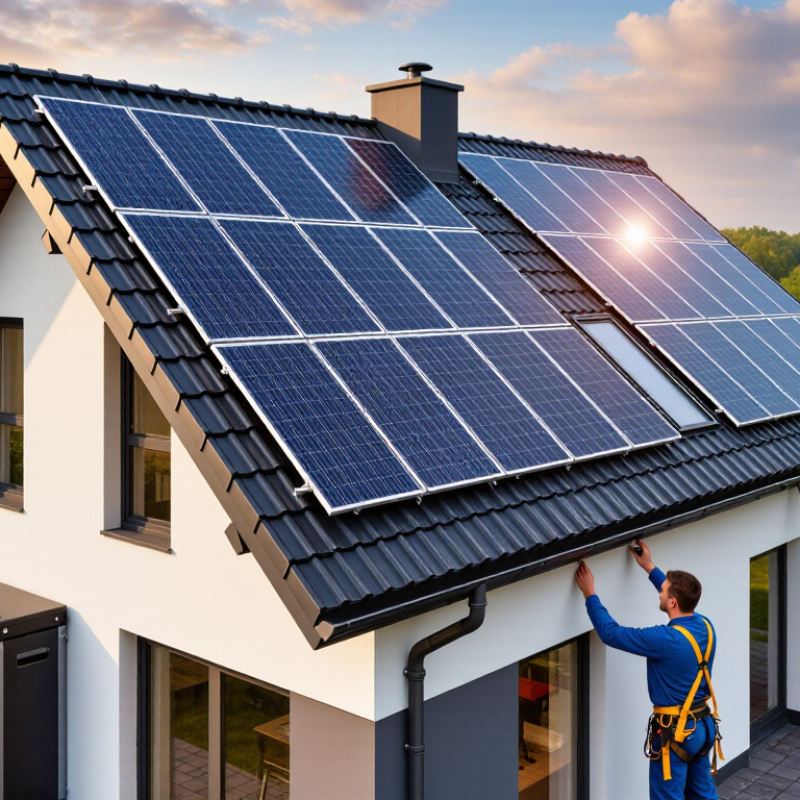
Check its orientation, pitch, age, and usable area. A south-facing roof often performs well in many regions, but local conditions matter more than general rules. Inspect shade at 9 a.m., noon, and 3 p.m. Tall trees, chimneys, and nearby buildings can reduce output. Measure the clear roof sections carefully. Leave access paths for maintenance. Small details matter.
Ask a qualified installer to assess structural strength, wiring, ventilation, and local snow or wind loads. Compare panels by efficiency, temperature performance, degradation rate, and warranty terms. Match the panel layout to the roof, rather than forcing the roof to fit a preferred design. I once treated a PVWatts estimate as a target, then noticed afternoon shade had been overlooked. That mistake changed the expected production. Recheck your assumptions before signing anything.
Compare Panel Technologies and 20%+ Commercial Efficiencies Cited by NREL
Choosing solar panels in 2026 requires more than chasing the highest percentage. NREL’s Best Research-Cell Efficiencies chart separates laboratory records from commercial performance. That distinction matters. Leading crystalline-silicon modules commonly exceed 20% efficiency, while laboratory silicon cells perform substantially higher. The 2024 Fraunhofer ISE Photovoltaics Report also identifies advanced commercial modules above 23% efficiency. However, those figures describe module output under standard test conditions, not every rooftop.
Technology affects real performance. TOPCon and heterojunction designs can deliver strong efficiency and better temperature behavior than older conventional cells. They suit limited roofs, where each square metre matters. Thin-film panels may perform better under some low-light or high-temperature conditions, but they usually require more area. IEA PVPS market reports also show continued growth in high-efficiency crystalline-silicon deployment, supporting its mainstream commercial position.
Check the datasheet closely. Compare temperature coefficient, degradation rate, warranty terms, operating conditions, and measured output—not efficiency alone. A 23% module can lose its advantage if shading, dust, or poor ventilation reduces annual production. On a roof, I would measure morning and afternoon shadows before selecting a panel. Small errors happen. A professional installer should verify roof loading, cable routing, inverter compatibility, and local weather exposure. NREL’s PVWatts tool can estimate production, but its result remains an estimate, not a promise. Efficiency is only one part of the decision.
Assess Output Losses Using the Industry Benchmark of 0.3–0.5% Annual Degradation
When choosing solar panels in 2026, examine degradation before chasing peak efficiency. A panel producing 450 watts today may deliver less after years of heat, ultraviolet exposure, and humidity. The practical industry benchmark is approximately 0.3–0.5% annual degradation.
Small percentages accumulate. At 0.3% yearly degradation, a panel retains about 92.8% of its initial output after 25 years. At 0.5%, retention falls to roughly 88.2%. On a 10-kilowatt system, that difference can represent several thousand kilowatt-hours over its operating life. The calculation assumes steady decline, which real sites rarely provide.
Field performance can differ from ideal assumptions.
Field evidence matters. NREL’s degradation analysis found a median crystalline-silicon degradation rate near 0.5% annually, while IEA PVPS Task 13 reports that climate, installation quality, and operating conditions strongly affect results. Ask for independent test data, not only laboratory ratings. Check whether the stated rate includes the first-year light-induced loss, because some documents separate it from later degradation. That detail can change the financial forecast.
Inspect the roof, too. A dusty panel under repeated high temperatures may underperform a technically superior panel installed with better ventilation.
I have seen yield estimates fail because shading and inverter clipping were ignored. That is an uncomfortable reminder: degradation is only one loss factor.
Compare the manufacturer’s degradation curve with independent reliability testing, local weather data, and a 25-year production model. Avoid treating 0.3% as guaranteed performance. It is a planning benchmark, not a promise.
Calculate Lifetime Value with 25–30-Year Product and Performance Warranties
Choosing solar panels in 2026 requires more than comparing today’s price. A warranty can shape a system’s lifetime value. Product warranties usually cover defects in materials and workmanship. Performance warranties address energy output over time. These promises are different. Read both documents carefully.
Suppose a 5-kilowatt system costs $8,000 after applicable incentives. If its panels carry a 30-year performance warranty, check the starting output and degradation rate. A 0.4% yearly loss leaves about 88.7% output after 30 years. At 0.5%, the figure falls to about 86%. That difference affects electricity savings, especially during hot summers. I once focused too heavily on the headline warranty length. That was a weak comparison. The exclusions mattered more.
Look for coverage of labor, shipping, removal, roof access, and replacement parts. Some policies cover only the panel, leaving installation costs with the owner. Confirm who handles claims and whether coverage transfers after a property sale. Keep invoices, serial records, commissioning reports, and production data. A monitoring screenshot from a hot July afternoon may support a claim, but it cannot replace formal documentation. Compare energy value with maintenance, inverter replacement, financing, and insurance costs. A longer warranty is not automatically better. Clear terms matter. Ask a qualified installer to model cash flow with conservative production estimates, not perfect weather.
How to Choose Solar Power Panels in 2026?
Calculate lifetime value with 25–30-year product and performance warranties.
Under the same operating conditions, a 30-year warranty term can deliver approximately 19% more cumulative energy than a 25-year term. The estimate uses a 1 kW solar installation, 1,400 kWh of first-year energy production, 1% first-year degradation, 0.4% annual degradation thereafter, and an electricity value of $0.15 per kWh.
Values represent modeled gross energy value before installation costs, financing, maintenance, taxes, incentives, and local electricity-price changes. Actual results depend on climate, orientation, shading, system losses, and energy prices.
Verify IEC 61215, IEC 61730, UL Certification, and Installer Credentials
Choosing solar panels in 2026 requires more than comparing wattage and price. The IEA PVPS Trends 2024 report recorded more than 450 GW of new photovoltaic capacity installed worldwide in 2023. That rapid growth makes verification essential. Ask for an IEC 61215 certificate covering the exact panel model. It confirms design qualification and performance testing. IEC 61730 addresses electrical and fire safety. Check the certificate number, testing scope, validity, and manufacturing location. A printed logo alone proves little.
UL Certification may be required by local authorities, utilities, or insurers. Confirm the product in the certification body’s online database. The listing should match the model, electrical rating, and installation conditions. Do not accept a similar model as a substitute. Small differences matter. The IEA PVPS Safety and Sustainability reports repeatedly highlight traceability and installation quality as practical risk controls.
Installer credentials deserve equal attention. Request an active electrical license, liability insurance, worker coverage, project references, and evidence of permit experience. Ask who performs roof penetrations and final testing. The installer should explain grounding, cable routing, shutdown procedures, and expected annual output. NREL research commonly uses approximately 0.5% yearly degradation as a planning benchmark, but local heat, dust, and shading can change results. I would leave room for uncertainty. A certificate cannot fix poor workmanship, and a confident sales promise is not technical evidence.